Analytics and Marketing

Visualise Your Training Data in Power BI Dashboards

Cut Report Preparation Time by 80%

Preparing the training report for the board by hand every month means spending more time merging spreadsheets than reading the data. Vedubox sends your data to Power BI and turns attendance, completion and certificate metrics into live dashboards.
Integration screenshot

The Cost of a Training Report Prepared by Hand

When training data stays cut off from the organisation's other business intelligence dashboards, management decisions get made on an incomplete picture.

Repeating the same report preparation

Building the same report by hand every period means the training team spends its time merging spreadsheets instead of analysing.

Disconnect from corporate dashboards

With HR, sales and operations dashboards in Power BI, leaving training data outside prevents any joined-up analysis.

Delayed visibility

Reports prepared monthly delay noticing incomplete mandatory training by weeks.

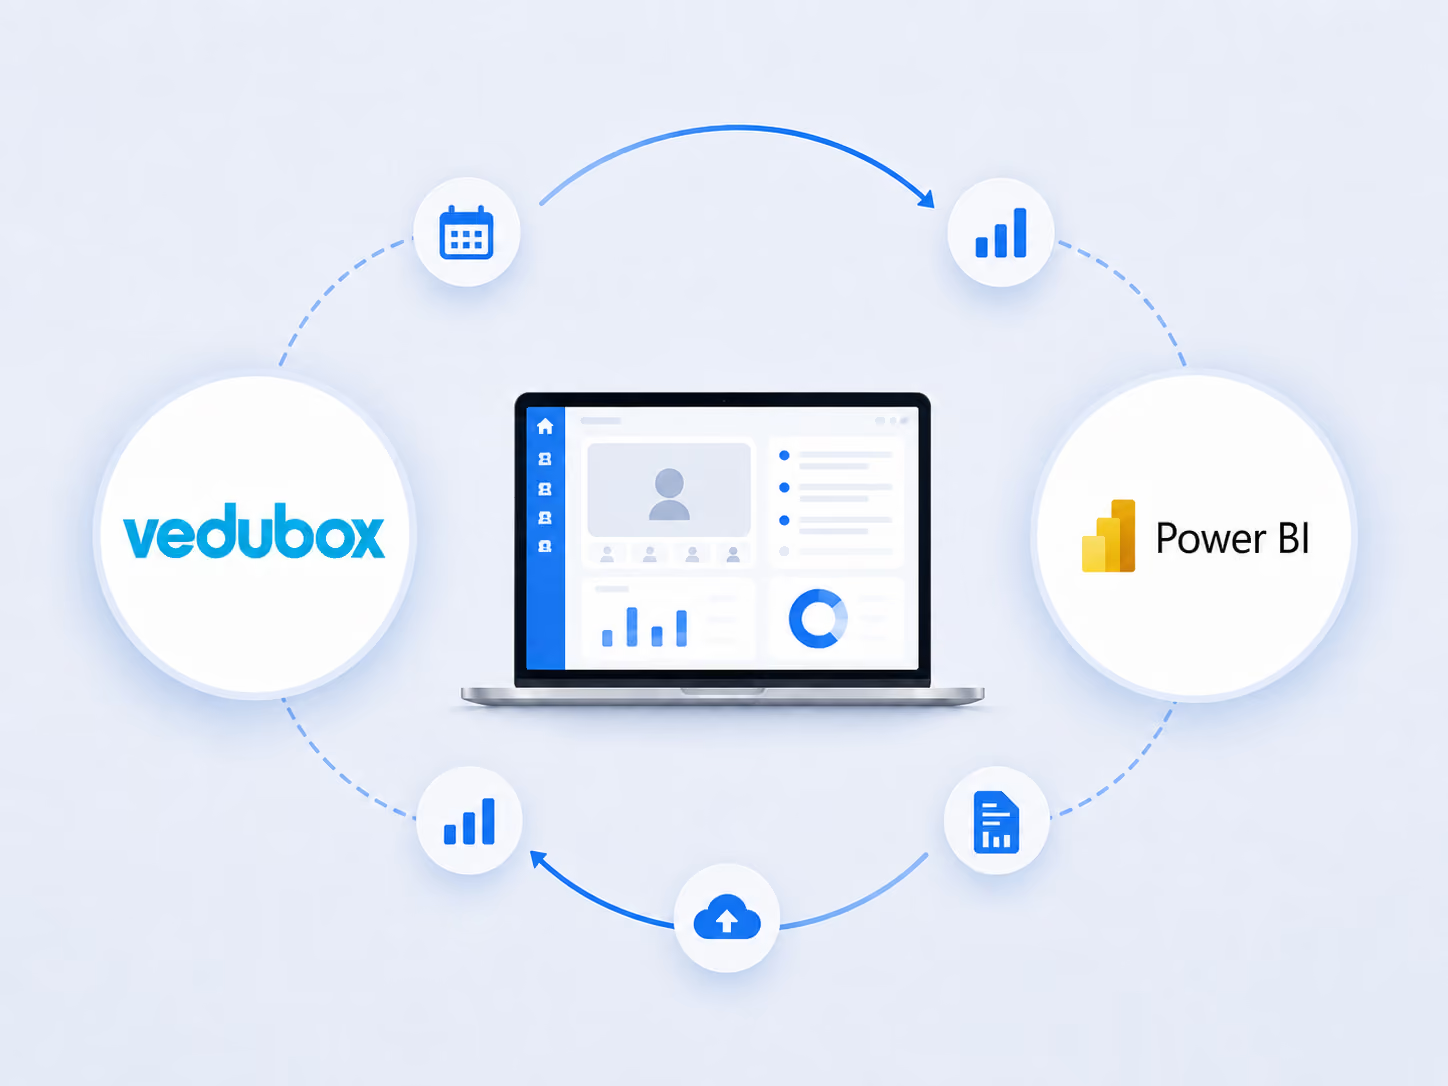
The Vedubox + Power BI integration brings training attendance, completion data and corporate business intelligence dashboards together in a single reporting chain

Let data flow live into your dashboards

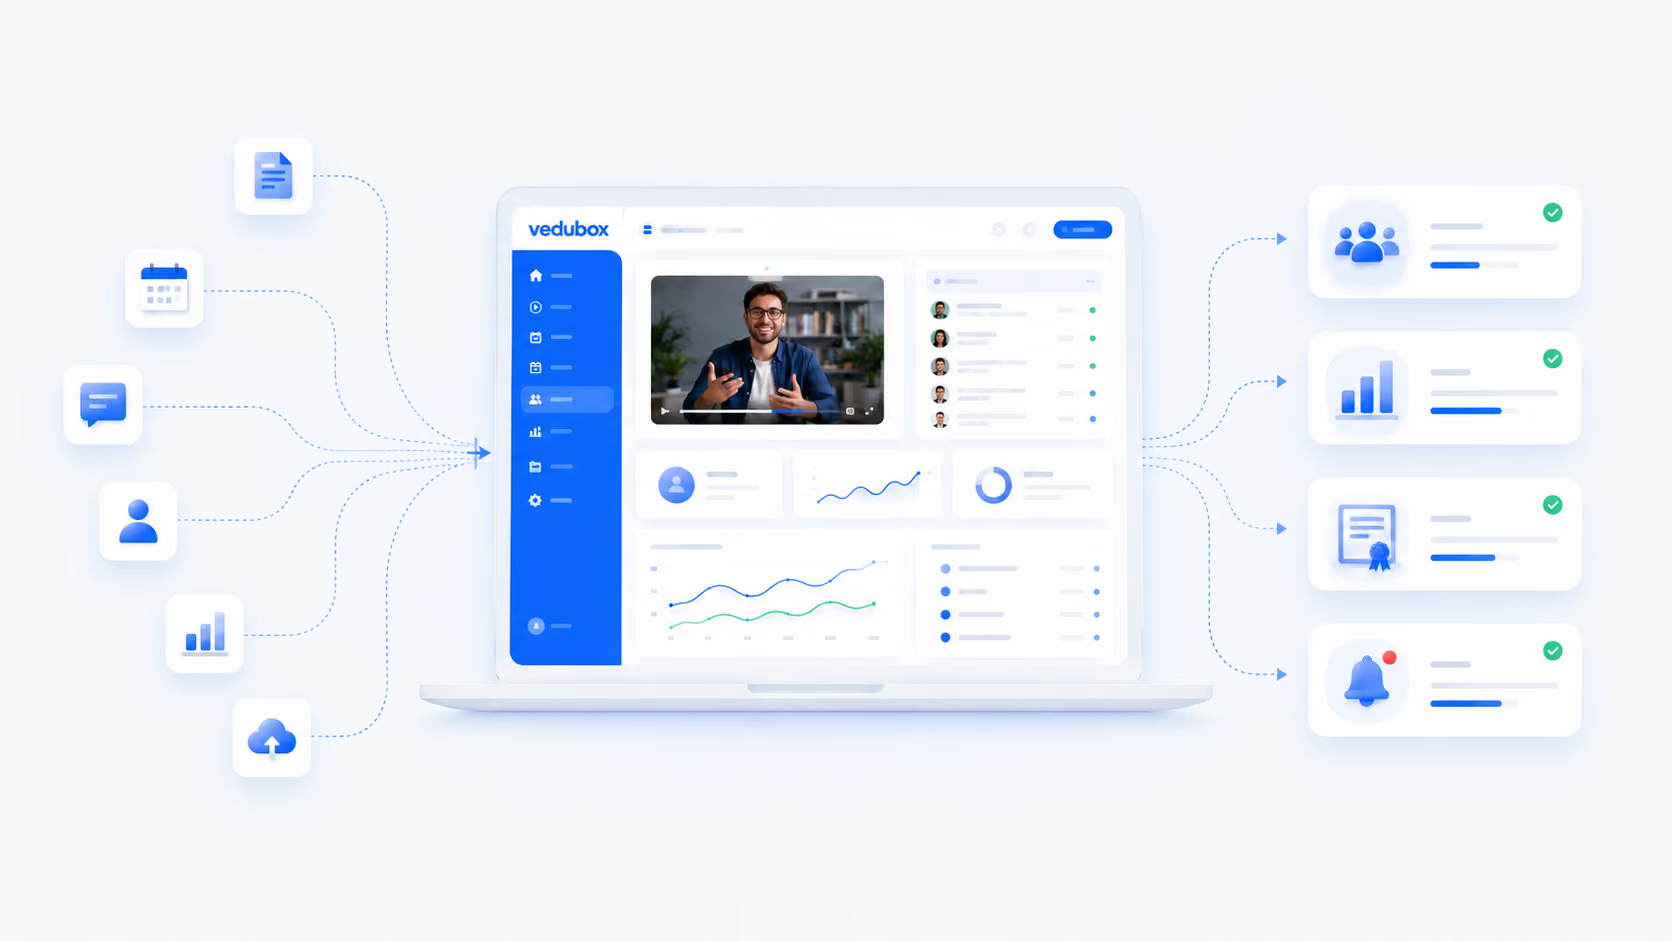
Attendance, completion and certificate data is sent to Power BI.
Dashboards work with current data, so there is no report to build by hand.
Analysis can be broken down by department, branch and job title.
Vedubox screen
Vedubox reporting screen

Base management decisions on current data

Mandatory training completion rates are tracked by unit.
Ready-made reports are produced for regulatory inspections.
The relationship between training investment and performance can be modelled.
Threshold alerts can be set for at-risk units.
Dashboards can be presented to the board automatically on a regular basis.

What to Expect From This Integration

80%
Shorter report preparation time

Having data flow into dashboards automatically largely removes the job of building reports and merging spreadsheets each period.

50%
Faster decisions

Dashboards running on current data mean incomplete mandatory training is spotted immediately rather than weeks later.

100%
Corporate data integrity

Modelling training data alongside the organisation's other business intelligence sources makes joined-up analysis possible.

The figures here indicate a typical improvement expectation; they are not a commitment and will vary with your organisation's existing processes.

Frequently Asked Questions

Which data can be transferred?

Reportable data such as attendance times, training completion status, exam results and certificate records can be sent to the dashboards.

How often is the data refreshed?

The refresh frequency is configured to your organisation's needs; a periodic refresh is set so dashboards work with current data.

Does it work with our existing Power BI licence?

Yes. The integration runs on your organisation's existing Power BI environment; you do not need to buy an additional licence.

Can we combine training data with HR data?

Yes. Training data can be modelled inside Power BI alongside the organisation's other data sources to create joined-up analyses.

Can ready-made reports be produced for audits?

Yes. Mandatory training completion rates and attendance records can be arranged as audit-ready dashboards.

Visualise Your Training Data With Vedubox + Power BI

Join more than 350 corporate organisations who rely on Vedubox to run their learning ecosystems cleanly, securely and automatically. Connect the tools you use every day natively to your learning ecosystem.

Get a step ahead in your training with Vedubox

Whichever tools you use, Vedubox works seamlessly with all of them.

Round-the-clock technical support

Your system is ready in seconds

Vedubox

LMS

Live Training

Exams

Certificates

Academy